Difference between revisions of "Debugger"
| (11 intermediate revisions by the same user not shown) | |||
| Line 1: | Line 1: | ||
| + | <div class="version_ge3.3"> | ||
==VulCon Debugger== | ==VulCon Debugger== | ||
Starting from {{GVESB}} v3.3, {{VULCON}} Eclipse plugin has been enhanced with a new feature: the graphical debugger. Now it’s possible to deploy and follow running flows in a {{GVESB}} server, having control about stepping, execution and environment (variables). | Starting from {{GVESB}} v3.3, {{VULCON}} Eclipse plugin has been enhanced with a new feature: the graphical debugger. Now it’s possible to deploy and follow running flows in a {{GVESB}} server, having control about stepping, execution and environment (variables). | ||
| Line 10: | Line 11: | ||
Right-clicking the Operation to debug, the contextual menu is opened and you can choose "Deploy & Debug". When "Deploy & Debug" menu voice is selected, a new Debug launch configuration for the selected Operation is created and the {{GVESB}} server is contacted and made ready for service debugging. Afterward, within a minute, the user must start the service in the ESB. | Right-clicking the Operation to debug, the contextual menu is opened and you can choose "Deploy & Debug". When "Deploy & Debug" menu voice is selected, a new Debug launch configuration for the selected Operation is created and the {{GVESB}} server is contacted and made ready for service debugging. Afterward, within a minute, the user must start the service in the ESB. | ||
==VulCon Debug Perspective== | ==VulCon Debug Perspective== | ||
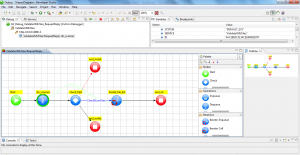
| − | [[File: | + | [[File:vulcondebug.png|thumb|{{VULCON}} Debug]] |
After the service to debug has been started, the {{GVESB}} server stops service execution on the first node of the flow, following the "Start" node. | After the service to debug has been started, the {{GVESB}} server stops service execution on the first node of the flow, following the "Start" node. | ||
If not, a graphical view of the operation is opened, and the node, where the execution is currently hold, is sharpened with a green pattern. | If not, a graphical view of the operation is opened, and the node, where the execution is currently hold, is sharpened with a green pattern. | ||
| Line 17: | Line 18: | ||
*<code>Full red</code>: used to signal a node where a breakpoint is set. | *<code>Full red</code>: used to signal a node where a breakpoint is set. | ||
*<code>Half red, half green</code>: used to signal the node where the execution is currently hold as well a breakpoint is set. | *<code>Half red, half green</code>: used to signal the node where the execution is currently hold as well a breakpoint is set. | ||
| + | |||
==Debug View== | ==Debug View== | ||
The ''Debug view'', normally placed on the top left side of the perspective, shows the parts of the {{GVESB}} operation flow call stack which are currently executed and how they relate to each other. Following is the {{VULCON}} Debugger call stack structure: | The ''Debug view'', normally placed on the top left side of the perspective, shows the parts of the {{GVESB}} operation flow call stack which are currently executed and how they relate to each other. Following is the {{VULCON}} Debugger call stack structure: | ||
| Line 43: | Line 45: | ||
</syntaxhighlight> | </syntaxhighlight> | ||
==Breakpoint== | ==Breakpoint== | ||
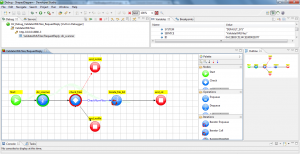
| − | [[File: | + | [[File:breakpoint.png|thumb|{{VULCON}} Debug Breakpoint]] |
On the graphical view of an operation, is possible to toggle breakpoints from the contextual menu of a node using the voice ''Toggle Breakpoint''. | On the graphical view of an operation, is possible to toggle breakpoints from the contextual menu of a node using the voice ''Toggle Breakpoint''. | ||
Breakpoints shown on ''Breakpoint View'' have following structure: | Breakpoints shown on ''Breakpoint View'' have following structure: | ||
| Line 49: | Line 51: | ||
- Service [Service Name] Operation [Operation Name] Node [Node Name] | - Service [Service Name] Operation [Operation Name] Node [Node Name] | ||
</syntaxhighlight> | </syntaxhighlight> | ||
| + | |||
==VulCon Debug execution control== | ==VulCon Debug execution control== | ||
[[File:buttons.png|thumb|{{VULCON}} Debug buttons]] | [[File:buttons.png|thumb|{{VULCON}} Debug buttons]] | ||
| Line 66: | Line 69: | ||
|- | |- | ||
|} | |} | ||
| + | =={{VULCON}} Debug Preferences== | ||
| + | A new preference link has been added where it’s possible to set preferences for the {{VULCON}} Debugger. | ||
| + | <syntaxhighlight lang="XML"> | ||
| + | Windows --> Preferences --> Vulcon --> Vulcon Debug | ||
| + | </syntaxhighlight> | ||
| + | *<code> GreenVulcanoESB debugger URL</code>: Base URL to connect to {{GVESB}}. | ||
| + | *<code> GreenVulcanoESB debug username</code>: Username used to access the deploy service. | ||
| + | *<code> GreenVulcanoESB debug password</code>: Password used to authenticate the user. | ||
| + | ==Launch Configurations== | ||
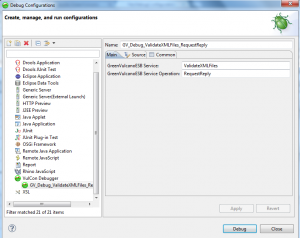
| + | [[File:debugConf.png|thumb|{{VULCON}} Debug Configuration]] | ||
| + | Launch configurations are created by "Deploy & Debug" option from the service’s operation contextual menu, or using the New option right clicking the "{{VULCON}} Debugger" from Run->“Debug Configuration…” menu. | ||
| + | Following is a snapshot of {{VULCON}}Debugger launch configuration: | ||
| + | <syntaxhighlight lang="XML"> | ||
| + | Run --> Debug Configuration --> VulCon Debugger | ||
| + | </syntaxhighlight> | ||
| + | A {{VULCON}} launch configuration is composed by a name identifying the launch configuration and following tabs: | ||
| + | ;Tab Main: | ||
| + | The Main Tab allows the user to customize settings for the launch configuration. | ||
| + | *<code>{{GVESB}} Service</code>: Service’s name to debug. | ||
| + | *<code>{{GVESB}} Service Operation</code>: Service’s operation name. | ||
| + | ;Tab Source: | ||
| + | The Source tab is a standard Eclipse option that allows you to control where Eclipse will look for your source files. | ||
| + | ;Tab Commons: | ||
| + | The Common Tab is a tab that is available to all PDE and Java launch configurations. It defines general aspects of the launch configuration including storage location, console encoding, etc. | ||
| + | </div> | ||
Latest revision as of 17:00, 4 March 2013
Contents
VulCon Debugger
Starting from GreenVulcano® ESB v3.3, VulCon Eclipse plugin has been enhanced with a new feature: the graphical debugger. Now it’s possible to deploy and follow running flows in a GreenVulcano® ESB server, having control about stepping, execution and environment (variables). VulCon Debugger allows the user to view and modify variables currently existing in a well determined execution point of the running service. Using the debugger, the developer is able to augment its productivity, diagnose anomalies and bugs, finally increase the troubleshooting.
Starting the debugger
Using the VulCon "Core" view, it’s possible to retrieve, deploy and start the VulCondebug feature. Firstly you should choose the service’s operation to debug:
GVServices --> Services ---> Service (Name).
Right-clicking the Operation to debug, the contextual menu is opened and you can choose "Deploy & Debug". When "Deploy & Debug" menu voice is selected, a new Debug launch configuration for the selected Operation is created and the GreenVulcano® ESB server is contacted and made ready for service debugging. Afterward, within a minute, the user must start the service in the ESB.
VulCon Debug Perspective
After the service to debug has been started, the GreenVulcano® ESB server stops service execution on the first node of the flow, following the "Start" node. If not, a graphical view of the operation is opened, and the node, where the execution is currently hold, is sharpened with a green pattern. Following is a list of possible node’s color patterns:
Full green: used to signal the node where the execution is currently hold.Full red: used to signal a node where a breakpoint is set.Half red, half green: used to signal the node where the execution is currently hold as well a breakpoint is set.
Debug View
The Debug view, normally placed on the top left side of the perspective, shows the parts of the GreenVulcano® ESB operation flow call stack which are currently executed and how they relate to each other. Following is the VulCon Debugger call stack structure:
- <Launch Configuration Name> [VulCon Debugger]
  - <Service Name>
    - <Thread Name>
      - <Service Name> / <Operation Name> / <Sub Flow Name>
Variables View
Variables View displays fields and local variables from the environment of the current execution stack. Variables View in VulCon debugger has following structure:
- <environment id>: when GVBuffer composed by following fields.
    * OBJECT: object field on GVBuffer.
    * ID: id field on GVBuffer.
    * SYSTEM: system field on GVBuffer.
    * SERVICE: service field on GVBuffer.
    * RETCODE: retcode field on GVBuffer.
    * PROPERTIES: list of properties on GVBuffer.
      * <prop name>: property of GVBuffer
- <environment id>: when exception composed by following fields.
    * Message: exception’s message.
    * Cause: first exception’s cause.
Breakpoint
On the graphical view of an operation, is possible to toggle breakpoints from the contextual menu of a node using the voice Toggle Breakpoint. Breakpoints shown on Breakpoint View have following structure:
- Service [Service Name] Operation [Operation Name] Node [Node Name]
VulCon Debug execution control
VulCon integrates the Debugger Framework in Eclipse; buttons provided in the toolbar have the same meaning of debugging a Java program. Therefore, following is a table that summarizes debugging key bindings:
| Key Binding | Description |
|---|---|
| F5 | Executes the currently selected flow node and goes to the next node of the flow. If the selected flow node is a sub flow call or a core call, the debugger steps into the associated code. |
| F6 | Steps over the call, i.e. it executes a flow node without entering it in the debugger. |
| F7 | Goes to the caller of the currently executed flow node. This finishes the execution of the current flow and returns to the caller of this method. |
| F8 | Tells the VulCon debugger to continue to execute the operation flow until it reaches the next breakpoint or the termination of the flow |
VulCon Debug Preferences
A new preference link has been added where it’s possible to set preferences for the VulCon Debugger.
Windows --> Preferences --> Vulcon --> Vulcon Debug
GreenVulcanoESB debugger URL: Base URL to connect to GreenVulcano® ESB.GreenVulcanoESB debug username: Username used to access the deploy service.GreenVulcanoESB debug password: Password used to authenticate the user.
Launch Configurations
Launch configurations are created by "Deploy & Debug" option from the service’s operation contextual menu, or using the New option right clicking the "VulCon Debugger" from Run->“Debug Configuration…” menu. Following is a snapshot of VulConDebugger launch configuration:
Run --> Debug Configuration --> VulCon Debugger
A VulCon launch configuration is composed by a name identifying the launch configuration and following tabs:
- Tab Main
The Main Tab allows the user to customize settings for the launch configuration.
GreenVulcano® ESB Service: Service’s name to debug.GreenVulcano® ESB Service Operation: Service’s operation name.
- Tab Source
The Source tab is a standard Eclipse option that allows you to control where Eclipse will look for your source files.
- Tab Commons
The Common Tab is a tab that is available to all PDE and Java launch configurations. It defines general aspects of the launch configuration including storage location, console encoding, etc.


