Difference between revisions of "GV Console"
(→{{GVCONSOLE}} Menu) |
|||
| (59 intermediate revisions by 5 users not shown) | |||
| Line 1: | Line 1: | ||
| − | == | + | ==Description== |
| − | |||
| − | |||
| − | |||
| − | + | The {{GVCONSOLE}} is a Web Application providing a centralized tool to manage, monitor and administer all the {{GVESB}} instances. | |
| − | |||
| − | + | This application makes the deployment of Services on the {{GVESB}} servers easier, helps the functional testing, the log listing and system performance visualization. | |
| − | |||
| + | ==Access== | ||
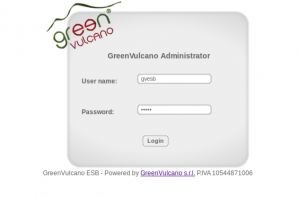
| + | [[File:GVConsoleAccess.png|thumb|Access GVConsole]] | ||
| − | |||
| − | |||
| − | |||
| − | |||
| − | |||
| − | |||
| − | |||
| − | |||
| − | |||
| − | + | {{GVESB}} Console can be accessed at the URL: | |
| − | |||
| − | |||
| − | |||
| − | |||
| − | + | : <nowiki>http://ipAddress:port/gvconsole</nowiki> (Ex. http://localhost:8080/gvconsole) | |
| − | |||
| − | |||
| − | + | where ''ipAddress'' is the server address where the application has been deployed and ''gvconsole'' is the name given to the web application. | |
| + | In order to display the web console, users must login by submitting a valid administrator account credentials. | ||
| − | == | + | =={{GVCONSOLE}} Menu== |
| − | + | With the {{GVCONSOLE}} you can: | |
| − | + | [[File:GVConsoleInitPage.jpg|thumb|400px|GVConsole]] | |
| − | + | * Deploy a new service ([[Deploy New Services]]); | |
| + | * Modify the {{GVESB}} XML configuration ([[Parameter]]); | ||
| + | * Manage WebService deployment ([[Web Services]]); | ||
| + | * Use {{GVCONSOLE}} Tools ([[Utility]]) | ||
| + | * Test {{GVESB}} services ([[Testing]]); | ||
| + | * View the log messages ([[Log]]) | ||
| + | * Create BIRT reports ([[Report]]); | ||
| + | * Manage the SavePoint ([[SavePoint]]); | ||
| + | * Monitor JVM metrics ([[Monitoring]]). | ||
| − | == | + | ==Next steps== |
| − | + | In order to learn more about {{GVCONSOLE}} see [[Examples using the {{GVCONSOLE}}]] section. Otherwise, if you already know how this application works, you may want to [[Deploy New Services|deploy new services]] and test your [[{{VULCON}} first flow]]. | |
| + | {{VOTE}} | ||
Latest revision as of 08:49, 11 February 2012
Description
The GV Console is a Web Application providing a centralized tool to manage, monitor and administer all the GreenVulcano® ESB instances.
This application makes the deployment of Services on the GreenVulcano® ESB servers easier, helps the functional testing, the log listing and system performance visualization.
Access
GreenVulcano® ESB Console can be accessed at the URL:
- http://ipAddress:port/gvconsole (Ex. http://localhost:8080/gvconsole)
where ipAddress is the server address where the application has been deployed and gvconsole is the name given to the web application.
In order to display the web console, users must login by submitting a valid administrator account credentials.
GV Console Menu
With the GV Console you can:
- Deploy a new service (Deploy New Services);
- Modify the GreenVulcano® ESB XML configuration (Parameter);
- Manage WebService deployment (Web Services);
- Use GV Console Tools (Utility)
- Test GreenVulcano® ESB services (Testing);
- View the log messages (Log)
- Create BIRT reports (Report);
- Manage the SavePoint (SavePoint);
- Monitor JVM metrics (Monitoring).
Next steps
In order to learn more about GV Console see Examples using the GV Console section. Otherwise, if you already know how this application works, you may want to deploy new services and test your VulCon first flow. {{#w4grb_rate:}} <w4grb_ratinglist latestvotes items="5" nosort/>

