Difference between revisions of "Graphic Editor"
(Created page with "==Editor Graphics of {{GVESB}}==") |
(→Editor Graphics of {{VULCON}}) |
||
| (3 intermediate revisions by the same user not shown) | |||
| Line 1: | Line 1: | ||
| − | ==Editor Graphics of {{ | + | ==Editor Graphics of {{VULCON}}== |
| + | [[File:editorGraphics.png|thumb|Editor Graphics]] | ||
| + | Core from [[The views]], open the menu | ||
| + | <syntaxhighlight lang="XML"> | ||
| + | GVServices--> Services --> Service --> Operation | ||
| + | </syntaxhighlight> | ||
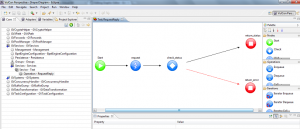
| + | and clicking the right mouse button choose Open Editor of Operation, In this way the user will open the prospect of the Graphic. The graphic editor {{VULCON}} located in the central part of the Prospect is the tool by which the user can draw a business flow. As an example of [[{{VULCON}} first flow]] , it can be done in two different ways, from Wizards or "free hand". This tool is very powerful because it allows the user to understand the life cycle of a flow in a visual way and not text, starting from the initial node "start" until at the end of the flow to the node, or "End", allowing the user to have a guide in more than usual XML file. | ||
| + | Each node in the stream has its own because, each node is connected by arrows that different as we have seen in the [[Palette]] differ by three different colors. | ||
| + | It also allows us to modify a stream already exists, how to add or delete a node, or you just select it and change it in Properties section at the bottom of the Outlook user can set the new configurations. | ||
Latest revision as of 10:31, 25 January 2012
Editor Graphics of VulCon
Core from The views, open the menu
GVServices--> Services --> Service --> Operation
and clicking the right mouse button choose Open Editor of Operation, In this way the user will open the prospect of the Graphic. The graphic editor VulCon located in the central part of the Prospect is the tool by which the user can draw a business flow. As an example of VulCon first flow , it can be done in two different ways, from Wizards or "free hand". This tool is very powerful because it allows the user to understand the life cycle of a flow in a visual way and not text, starting from the initial node "start" until at the end of the flow to the node, or "End", allowing the user to have a guide in more than usual XML file. Each node in the stream has its own because, each node is connected by arrows that different as we have seen in the Palette differ by three different colors. It also allows us to modify a stream already exists, how to add or delete a node, or you just select it and change it in Properties section at the bottom of the Outlook user can set the new configurations.
