Difference between revisions of "Log"
| Line 1: | Line 1: | ||
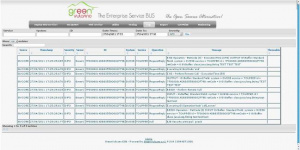
| − | This section visualizes the log messages stored into the database. | + | [[File:GVConsoleLog.jpg|thumb|Log viewer]] |
| + | |||
| + | This section visualizes the log messages stored into the database. User can access to this area using the "Log" panel. | ||
The logs messages can be filtrated to the service name (also partial), client system (also partial) and transaction ID, by log level, and research time interval. | The logs messages can be filtrated to the service name (also partial), client system (also partial) and transaction ID, by log level, and research time interval. | ||
| Line 7: | Line 9: | ||
The messages are paginated by groups of 100. This limit can be modified by the user. | The messages are paginated by groups of 100. This limit can be modified by the user. | ||
| − | Big messages (> 500 characters) will be substituted by the icon [[File:GVConsoleLogBigMessIcon.jpg]]. | + | [[File:GVConsoleLogMess.jpg|thumb|Big messages]]. |
| + | Big messages (> 500 characters) will be substituted by the icon [[File:GVConsoleLogBigMessIcon.jpg]]. | ||
| + | |||
| + | |||
| + | |||
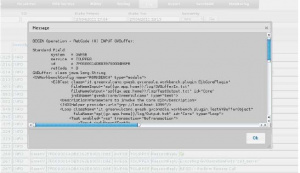
| + | [[File:GVConsoleLogMessView.jpg|thumb|Big message visualization]]. | ||
| + | These messages will be visualized clicking this icon. | ||
| − | |||
| − | |||
| − | |||
| + | |||
| + | |||
| + | [[File:GVConsoleLogMessRed.jpg|thumb|Messages with errors]] | ||
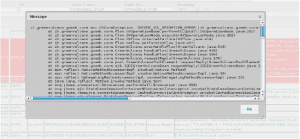
Messages at WARNING and ERROR levels will be highlighted in red. In case of exceptions this will be substituted by the icon [[File:GVConsoleLogExcIcon.jpg]] | Messages at WARNING and ERROR levels will be highlighted in red. In case of exceptions this will be substituted by the icon [[File:GVConsoleLogExcIcon.jpg]] | ||
| − | |||
| + | |||
| + | |||
| + | [[File:GVConsoleLogExcView.jpg|thumb|Exception details]] | ||
Exceptions will be visualized clicking this icon. | Exceptions will be visualized clicking this icon. | ||
| − | + | ||
| + | |||
| + | |||
Revision as of 14:04, 24 January 2012
This section visualizes the log messages stored into the database. User can access to this area using the "Log" panel.
The logs messages can be filtrated to the service name (also partial), client system (also partial) and transaction ID, by log level, and research time interval.
The log level is hierarchical, that's mean if it is filtered by INFO, it would by selected also the WARNING and ERROR messages.
The messages are paginated by groups of 100. This limit can be modified by the user.
.
Big messages (> 500 characters) will be substituted by the icon ![]() .
.
.
These messages will be visualized clicking this icon.
Messages at WARNING and ERROR levels will be highlighted in red. In case of exceptions this will be substituted by the icon ![]()
Exceptions will be visualized clicking this icon.
DB Log Enabling
GreenVulcano® ESB includes the "Log viewer" console prepared for accessing to a Oracle database. The connection is done through the parameters defined in the GVAdapters.xml file of the GVJDBCConnectionBuilder section. The statement for interacting with the DB are configurated into the GVSupport.xml file in the LogConsole section. The Log4J logger enabling for writing into the DB, is done in the GVSupport.xml file from the GVLog4JConfiguration section (disable by default).
The ddl scripts for defining the DB data structure and the configuration fragments for adding/rewriting into GVSupport.xml and GVAdapters.xml are in the directories:
- $GV_HOME/doc/extra/log/mysql
- $GV_HOME/doc/extra/log/oracle
Configuration fragments must be adequate to the specific connection parameters for the DB (url, user, password).


