Difference between revisions of "GV Console"
(→Access) |
(→Access) |
||
| Line 16: | Line 16: | ||
where ''ipAddress'' is the server address where the application has been deployed and ''gvconsole'' is the name given to the web console. | where ''ipAddress'' is the server address where the application has been deployed and ''gvconsole'' is the name given to the web console. | ||
| − | |||
| − | |||
In order to display the web console, user must login by submitting a valid administrative ''username'' and ''password''. | In order to display the web console, user must login by submitting a valid administrative ''username'' and ''password''. | ||
Revision as of 21:20, 24 January 2012
Definition
Once a service has been created, the user must be able to manage all the GreenVulcano® ESB infrastructure and monitoring the system on which it is working. Adding to these services its respective system, channel, operations, together with other elements valid for the GreenVulcano® ESB correct operation, the level of complexity increases. It is therefore necessary to have visibility and control system performance.
For this reason it was created the GV Console. Basically it is a Web Application which can centrally manage, monitor and administer all the GreenVulcano® ESB instances, making also easer the server application deployment and its posterior monitoring and maintenance.
Access
GreenVulcano® ESB Console is available at:
- http://ipAddress:port/gvconsole (Ex. http://localhost:8080/gvconsole)
where ipAddress is the server address where the application has been deployed and gvconsole is the name given to the web console.
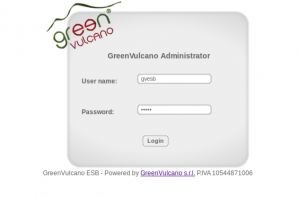
In order to display the web console, user must login by submitting a valid administrative username and password.
GV Console Menu
With the GV Console you can:
- deploy a new service (Deploy New Services);
- configure a parameter directly into the XML document (Parameter);
- configure the web service (Web Service);
- use the GV Console Tools (Utility)
- test the GreenVulcano® ESB services (Testing);
- view the log messages (Log)
- create reports (Report);
- see the save point (SavePoint);
- Monitor the JVM (Monitoring).
Next steps
In order to learn more about GV Console see Example using the GV Console section. Otherwise, if you already know how this web application works, you may want to deploy the new services and test your VulCon first flow.

