Monitoring
It is possible to access this area clicking on "Monitoring". This section controls the state of the Java Virtual Machine. Some JVMs, in which GreenVulcano® ESB instances are in function, can be configured. Into the GVSupport.xml file presents in the section "GVMonitoringConfig", the server connection parameters are set. Particularly, in this element the "MonitoredProcess" list is configured, containing the following attributes:
- Name: label to be present in the console (obligatory)
- URL: service:jmx:protocol:sap (ex. service:jmx:rmi:///jndi/rmi://localhost:9999/server)
- User: user, if credential connection if needed
- Password: password, if credential connection if needed
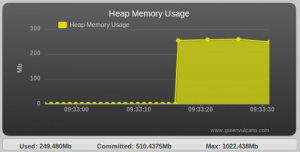
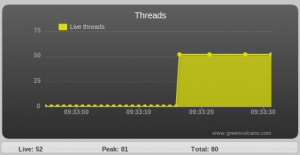
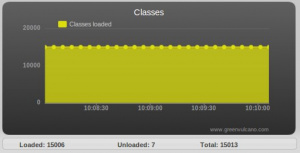
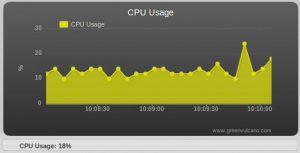
Accessing to the monitoring area through the console, four graphics can be visualized, representing the principal components of the selected Java Virtual Machine.
- Memory use:
- Used
- Riserved
- Maxim
- Threads:
- Live
- Peak
- Total
- Classes:
- Loaded
- Unloaded
- Total
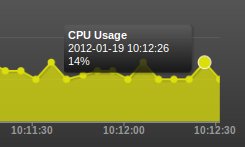
- CPU
- Used CPU
Passing with the mouse up the circles present into the graphic, it is possible to have more informations such as value at this point and data:

