GV Console
Contents
Definition
Once a service has been created, the user must be able to manage all the GreenVulcano® ESB infrastructure and monitoring the system on which it is working. Adding to these services its respective system, channel, operations, together with other elements valid for the GreenVulcano® ESB correct operation, the level of complexity increases. It is therefore necessary to have visibility and control system performance.
For this reason it was created the GV Console. Basically it is a Web Application which can centrally manage, monitor and administer all the GreenVulcano® ESB instances, making also easer the server application deployment and its posterior monitoring and maintenance.
Access
GreenVulcano® ESB Console is available at:
http://ipAddress:port/gvconsole (Ex. http://localhost:8080/gvconsole)
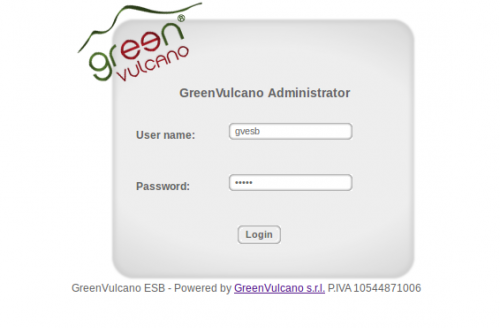
where ipAddress is the server address where the application has been deployed and gvconsole is the name given to the web console. In order to display the web console, user must login by submitting a valid administrative username and password.
Deploy New Service
In this section it is possible to deploy in Server the new services created with VulCon®. Deploy consists in adding the configurations of services, adapters, etc., present into the compress file created through the VulCon® wizard, into the GreenVulcano® ESB Server configuration.
After clicking in the "Deploy New Services" key, user can choose the zip file to upload and then click on "Submit".
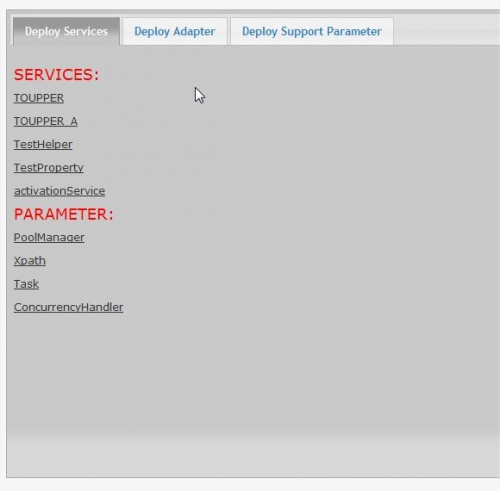
Once this step is completed, user can visualize a list of services and its relative parameters:
There are present three subsections:
Parameter
This section shows the GreenVulcano® ESB configuration files.
Configuration management shows the registered documents with their descriptions, the operations available for each document and a form to modify a document. Availability of documents and operations depends on the permissions granted to the application user.
For every file the user can:
Web Services
User can access into this area clicking on Web Service key:
This section is composed by three tabs:
Utility
This section contains the GV Console tools:
Testing
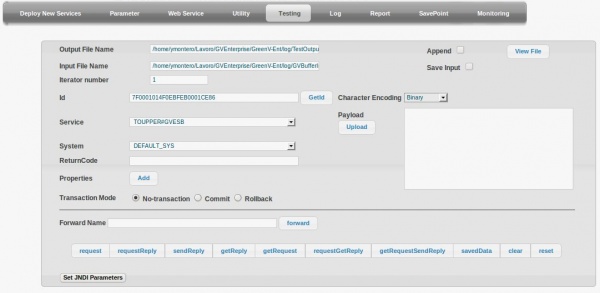
Testing is a Web application that provides a GreenVulcano® ESB service invocation simulating a client request.
The testing process is divided into three steps:
Log Viewer
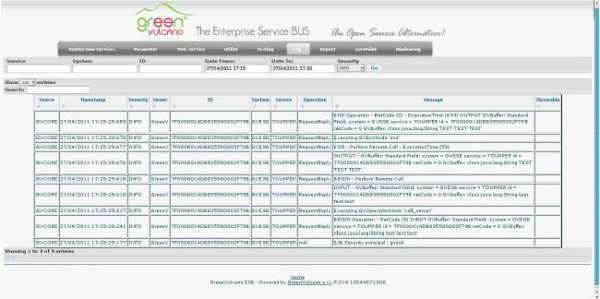
User can access to this area using the "Log" panel:
Report
User can access to this area clicking the "Report" key:
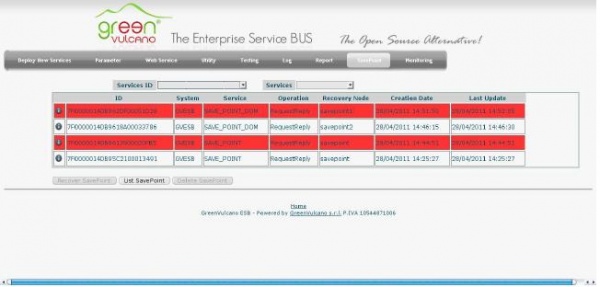
SavePoint
It is possible to access into this are with the "Save Point" key.
Monitoring
It is possible to access this area clicking on "Monitoring":
