GV Console
Contents
Definition
GreenVulcano® ESB is a Java-based software service platform able to support complex SOA architectures. Its multi-layer architecture allows an unlimited customization, solving most of enterprise integration issues like exchanging data between existing systems. Many plugins and adapters are already available for a huge flexibility.
Access
GreenVulcano® ESB Console is available at:
http://ipAddress:port/gvconsole (Ex. http://localhost:8080/gvconsole)
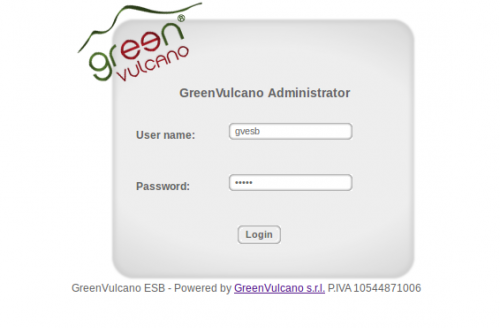
where ipAddress is the server address where the application has been deployed and gvconsole is the name given to the web console. In order to display the web console, user must login by submitting a valid administrative username and password.
Deploy New Service
In this section user may deploy a new service. Services are described by XML files, but it is necessary to compress them in a zip archive in order to upload them correctly.
As shown in Fig. choose the zip file to upload and then click on “Submit”.

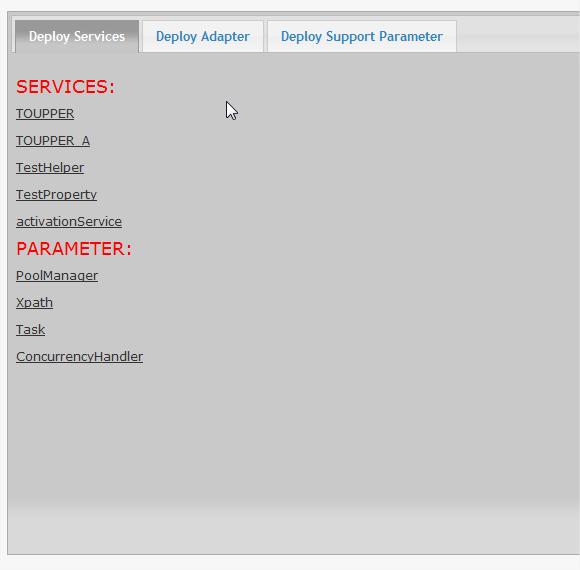
Once this step is completed, user can visualize a list of services.
There are present three subsections:
Parameter
This section shows the GreenVulcano® ESB configuration files.
Configuration management shows the registered documents with their descriptions, the operations available for each document and a form to modify a document. Availability of documents and operations depends on the permissions granted to the application user.
Available documents and operations depend on the user permission.
For every file the user can:
Web Services
Utility
This section contains the GV Console tools:
Testing
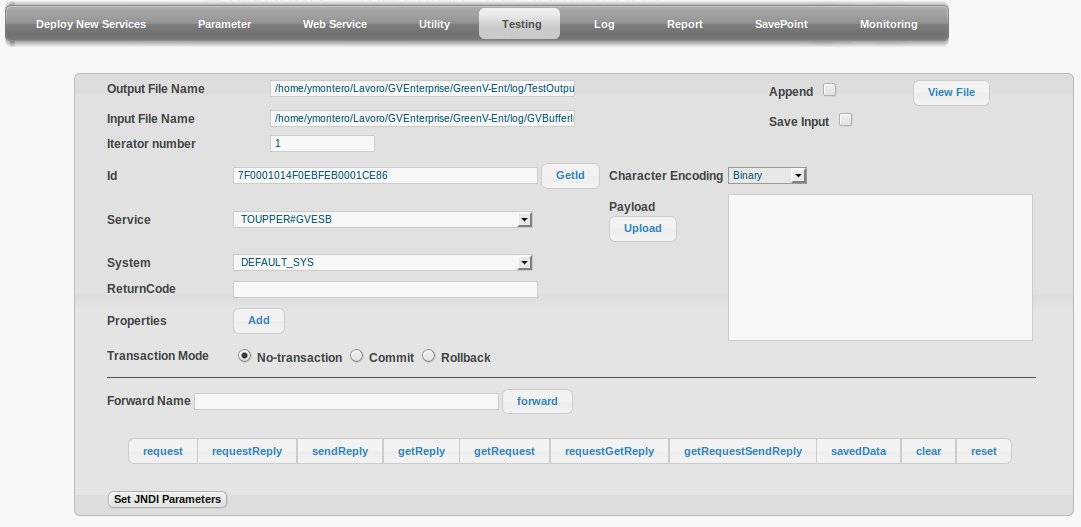
Testing is a Web application that provides a GreenVulcano® ESB service invocation simulating a client request.
The testing process is divided into three steps:
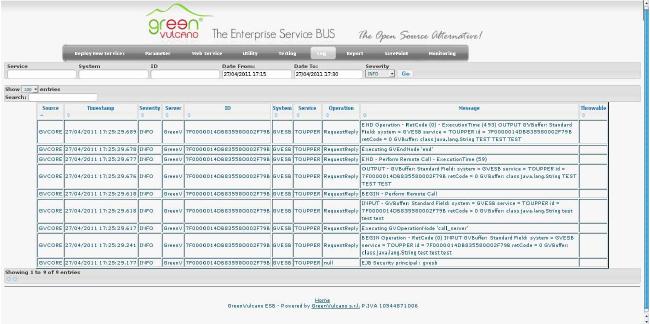
Log Viewer
User can access to this area using the "Log" panel:
Report
User can access to this area clicking the "Report" key:


